 简体中文
 繁體中文
 English
 Français
 Русский
 日本語
 Tiếng Việt
 한국어
 Deutsch
 Español
 Italiano
 Português
 العربية
 ไทย
 Bahasa Indonesia
 Bahasa Melayu
 Türkçe
 Polski
 Nederlands
 Dansk
 Norsk
 Қазақша
Prologue: How Far Apart Are Chinese and US AI Models, Really?
Prologue to a China–US AI model series, using a 2026-10-29 snapshot to compare frontier gaps, the Opus 4.8 threshold, and 112 API calls.
This is the English edition of the same study, with a data cutoff of 2026-10-29. All 112 test requests used the original Chinese prompts; no new multilingual evaluation was run. Figures use English labels. The code example preserves its original Chinese prompt through Unicode escapes, decoded at runtime.
China–US AI Model Comparison Series · Prologue. We begin by establishing a comparison method for text models, then examine image, video, speech, vector retrieval, and reranking separately. This article is the starting point for our methods and questions; text-model scores cannot represent capabilities in other modalities.
US models currently lead the frontier rankings and have the deeper top-tier lineup, but the claim that “the gap between Chinese and US models is continuously widening” does not match this same-scale retrospective analysis. Using Opus 4.8 as a reference threshold for personal satisfaction, the AA-covered sample contains 12 Chinese releases and 21 US releases with Progress Index scores above it; that does not mean every one is better for every task.
The data cutoff is October 29, 2026. This article separates three questions that are easily confused: how far apart the strongest models are, how many options have crossed an older flagship threshold, and which differences can actually be felt in real requests. The first two questions use Artificial Analysis (AA) data; the third is examined through an audit of 7 models, 8 tasks, 2 calls per task, for 112 calls in total via Crazyrouter.[1][2]
This is a study of a model sample. It does not assess the overall AI industries of either country, and no human subjective blind evaluation was conducted. Whether a model is “usable” ultimately depends on your tasks, tolerance for waiting, and error requirements.
Results first: frontier leadership and broad usability are two different things#
| Metric / scale | China | United States |
|---|---|---|
| Current highest score · Intelligence v5 | 46.0 · Kimi K3.1 Pro | 59.4 · Gemini 4 Carbon |
| Top 5 average · Intelligence v5 | 34.74 | 56.68 |
| Releases in the global Top 10 · Intelligence v5 | 1 | 9 |
| Current highest score · Progress v1 | 340.70 | 351.65 |
| Above Opus 4.8 · Progress v1, including historical releases | 12 | 21 |
| Of these, releases not marked deprecated by AA | 9 | 13 |
Values from the two indices cannot be subtracted from one another or ranked together. The current v5 frontier gap is 13.4 points; the current Progress v1 frontier gap is 10.94 points. The former measures performance on the current evaluation suite, while the latter is used to analyze changes in capability across periods.
The analysis consolidates AA’s 716 inference configurations into 517 releases, comprising 176 from China, 257 from the United States, and the remainder from other countries or unclassified. Releases are consolidated by release.id, so high, max, and xhigh configurations of the same release are not counted as multiple models. For each metric, the highest-scoring configuration for that release is used; the highest configuration may differ between metrics.
Only 39 releases currently have usable overall scores on the new v5 leaderboard: 12 from China, 24 from the United States, and 3 from other countries. The Top 10 and averages here describe the tested sample; a missing score does not mean zero. Rankings use the original precision returned by the API, with ties sharing the same rank and subsequent ranks skipped accordingly.[1]
The current top 20: who is at the top?#
| Global rank (releases deduplicated) | Release | Country | v5 score | Release date |
|---|---|---|---|---|
| 1 | Gemini 4 Carbon | United States | 59.4 | 2026-10-28 |
| 2 | Claude Opus 5.5 | United States | 58.4 | 2026-09-22 |
| 3 | GPT-6 Astra | United States | 56.9 | 2026-09-03 |
| 4 | GPT-6.1 Sol | United States | 54.5 | 2026-09-29 |
| 5 | Claude Sonnet 5.5 | United States | 54.2 | 2026-09-28 |
| 6 | GPT-6.1 Terra | United States | 51.0 | 2026-10-26 |
| 7 | Gemini 4 Argon | United States | 50.4 | 2026-09-30 |
| 8 | Muse Wonder Full | United States | 49.7 | 2026-10-12 |
| 8 | Claude Fable 5.1 | United States | 49.7 | 2026-09-01 |
| 10 | Kimi K3.1 Pro | China | 46.0 | 2026-10-23 |
| 11 | Muse Wonder | United States | 43.3 | 2026-10-12 |
| 12 | Muse Spark 1.3 | United States | 36.4 | 2026-09-02 |
| 13 | Claude Haiku 5.5 | United States | 36.2 | 2026-10-07 |
| 14 | Grok 4.7 | United States | 35.0 | 2026-09-21 |
| 15 | Qwen3.8 Max (0902) | China | 33.6 | 2026-09-02 |
| 16 | DeepSeek V4.1 Flash 1017 | China | 32.5 | 2026-10-17 |
| 17 | GLM-5.3 | China | 31.7 | 2026-08-18 |
| 18 | Gemini 3.8 Flash | United States | 30.5 | 2026-09-02 |
| 19 | MiMo-V2.6-Pro | China | 29.9 | 2026-09-21 |
| 20 | Ling 3.1 Flash 1019 | China | 29.5 | 2026-10-22 |
China holds 6 places in this top 20 and the United States holds 14; in the top 10, they hold 1 and 9 respectively. Together with the Top 5 averages of 34.74 and 56.68, this shows that closing the gap with an individual frontier model is different from matching the depth of the leading tier. Releases without overall scores are excluded from the ranking.[1]
Is the score gap continuing to widen?#
It is not continuously widening; it is clearly influenced by the timing of flagship releases. Using Progress Index v1 from the same data extraction, we reconstruct each country’s frontier according to release dates: the highest score among releases available before a given date becomes that date’s retrospective frontier.
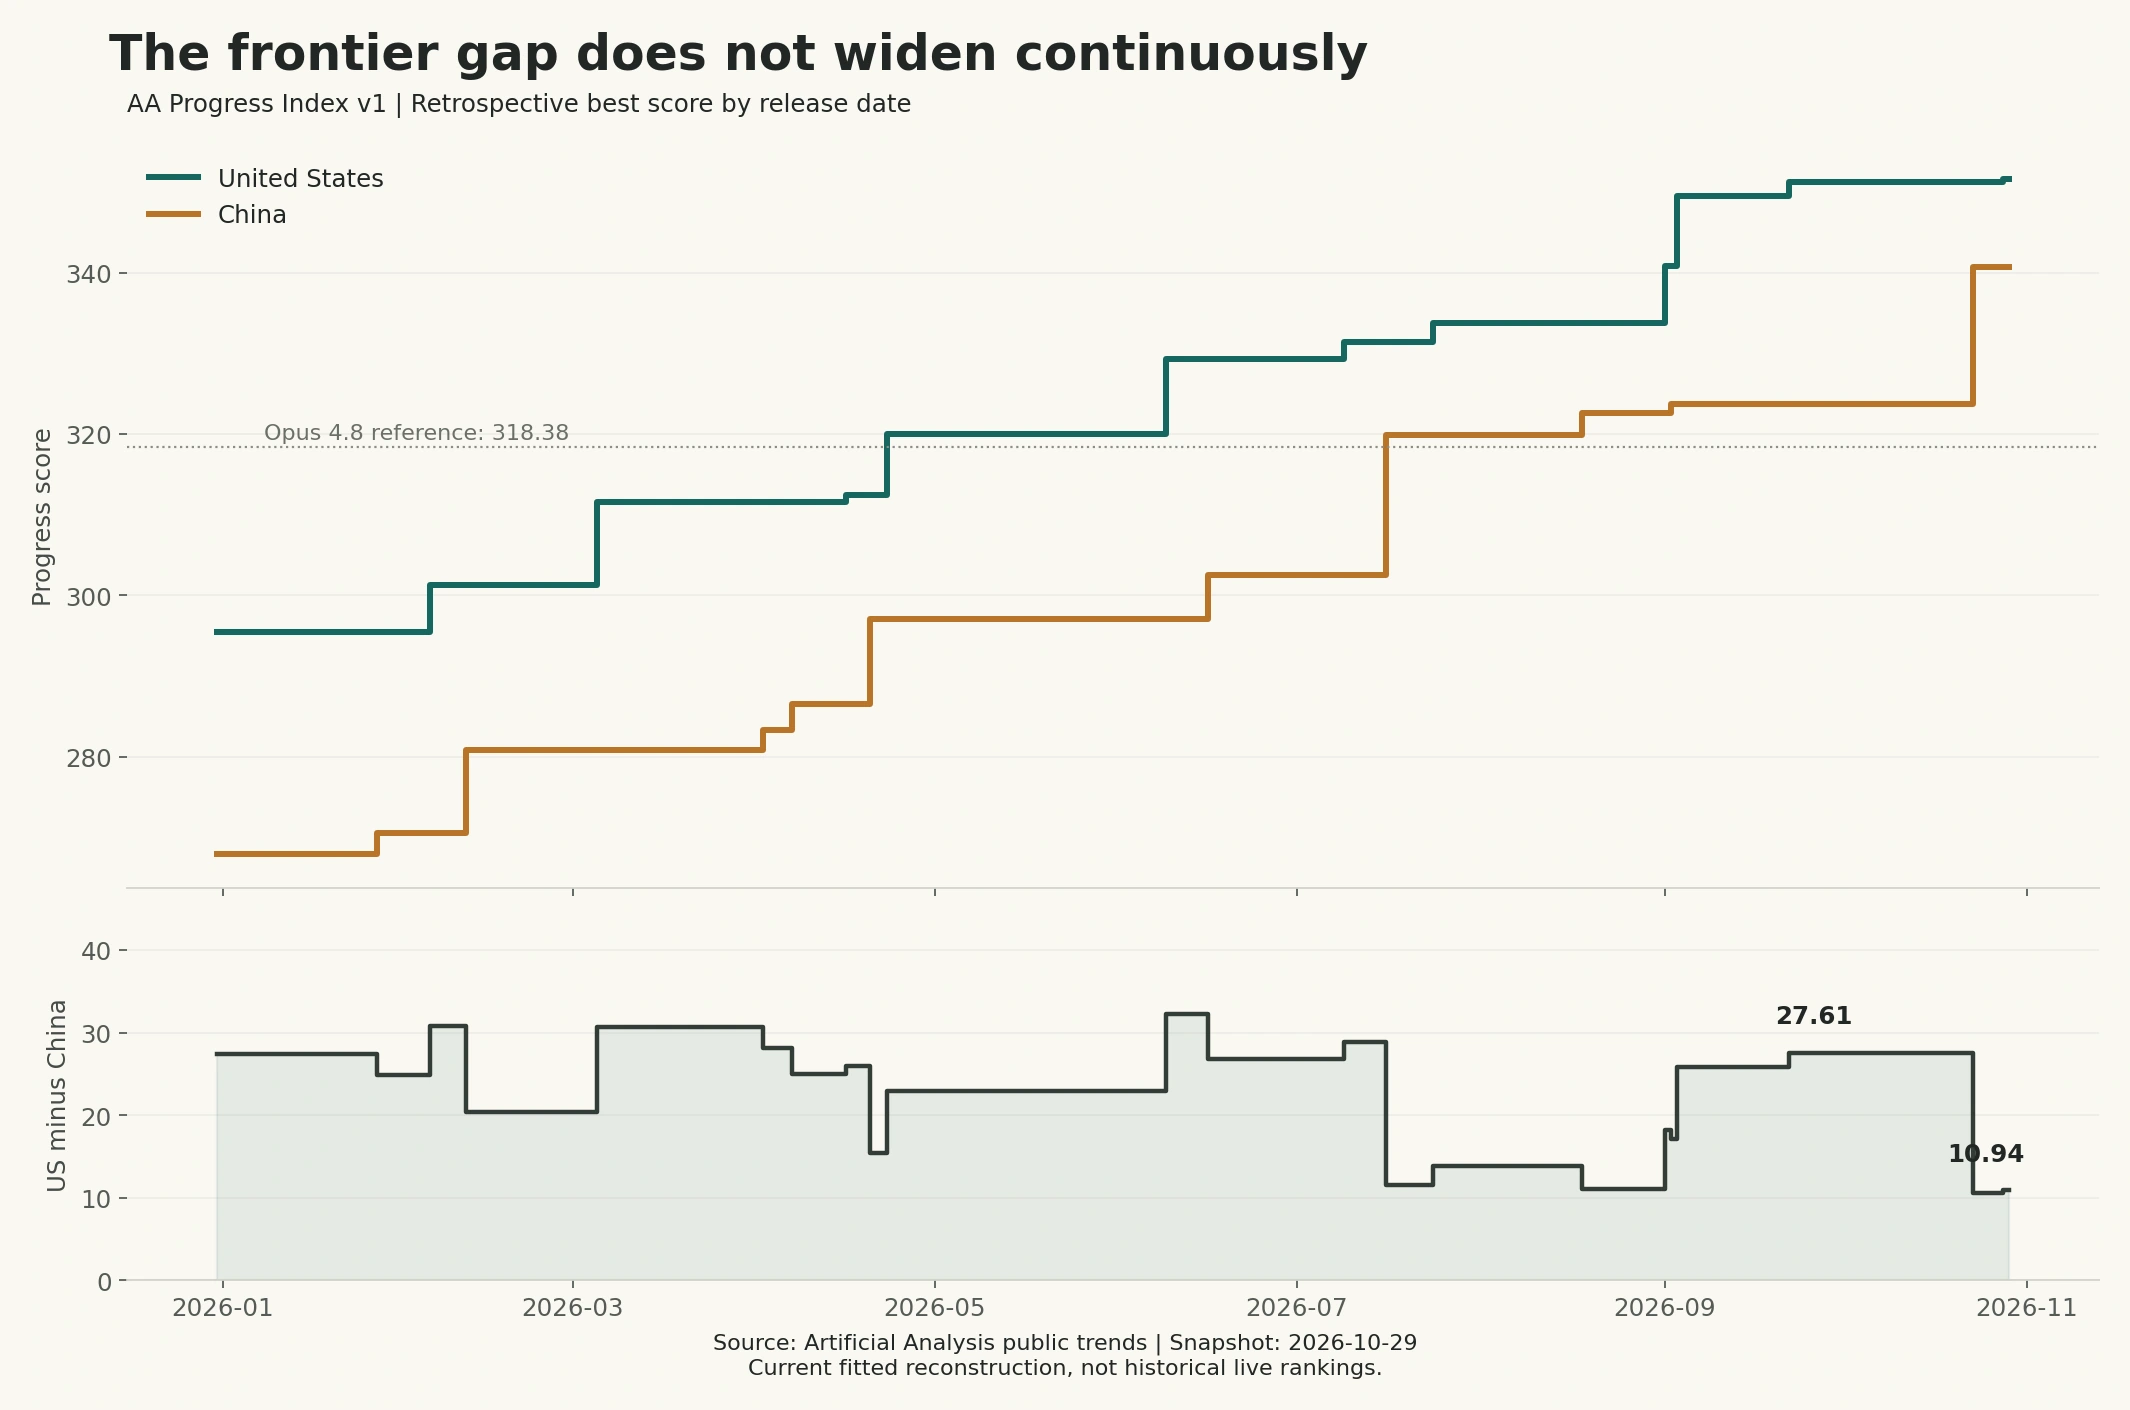
| Retrospective date | China frontier | US frontier | Gap: US − China |
|---|---|---|---|
| 2025-12-31 | 267.96 | 295.46 | 27.49 |
| 2026-03-31 | 280.87 | 311.55 | 30.69 |
| 2026-06-30 | 302.52 | 329.33 | 26.80 |
| 2026-07-31 | 319.88 | 333.73 | 13.85 |
| 2026-08-31 | 322.66 | 333.73 | 11.07 |
| 2026-09-30 | 323.67 | 351.27 | 27.61 |
| 2026-10-23 | 340.70 | 351.27 | 10.57 |
| 2026-10-29 | 340.70 | 351.65 | 10.94 |
The gap at the end of August 2026 was 11.07. After a cluster of new US flagship releases in September, it widened to 27.61 at month-end; the release of Kimi K3.1 Pro on October 23 narrowed it to 10.57; following the release of Gemini 4 Carbon on October 28, the October 29 snapshot showed 10.94.[2]
This makes the choice of time window part of the conclusion. The current gap is approximately 16.66 points smaller than 30 days ago, approximately 2.91 points smaller than 90 days ago, and approximately 12.00 points smaller than 180 days ago. At the same time, the United States still leads the bilateral frontier comparison. The gap can narrow while a lead remains.
However, this chart cannot be described as “the live leaderboard on every past day.” The Progress Index is a fitted reconstruction based on evaluations currently available, rather than historical live rankings; future testing and refitting may change retrospective scores. Historical API availability has also not been fully reconstructed. It answers the question, “How do previously released models look when measured with the same scale today?” not, “What could users actually call at the time?”[3]
Why might some people see the gap suddenly widen?#
AA upgraded the Intelligence Index to v5 on October 27, 2026, adding or upgrading evaluations for software engineering, scientific research, and knowledge reasoning. Its announcement states that the gap between the top of the open-weight category and the leading models increased from 3 points in v4.3 to 12 points in v5.[4]
This involves both changing the measuring scale and using a grouping of “open weights versus leading models.” It cannot simply be rewritten as “the China–US capability gap widened from 3 points to 12 points within two days.” The announcement also includes Kimi K3.1 Pro, whose weights had not yet been released, in its related description, so this grouping certainly cannot be equated with the set of models downloadable on that day.
v5 assigns 25% weight to each of four categories: knowledge work, coding, science, and general. This places greater emphasis on difficult tasks and multistep execution than ordinary chat alone. Consequently, leaderboard gaps can be large while differences on some everyday tasks are smaller; whether that is the case requires task-specific evidence.[4][5]
If Opus 4.8 is already good enough, how many models have surpassed it?#
First, we fix the scale. Opus 4.8’s 61.4 points in its May 2026 release evaluation belong to the old Intelligence Index and are not comparable with v5. In this API snapshot, its v5 overall score is blank. A blank cannot be treated as 0, and the old 61.4 certainly cannot be used to filter the new leaderboard.[1][6]
This article instead uses Opus 4.8 (max): 318.376758998036 in Progress Index v1 as the fixed reference. A score must be strictly greater to count as surpassing it; equality does not count, and missing scores are recorded as unknown. The threshold uses full precision, while tables retain only two decimal places.[2]
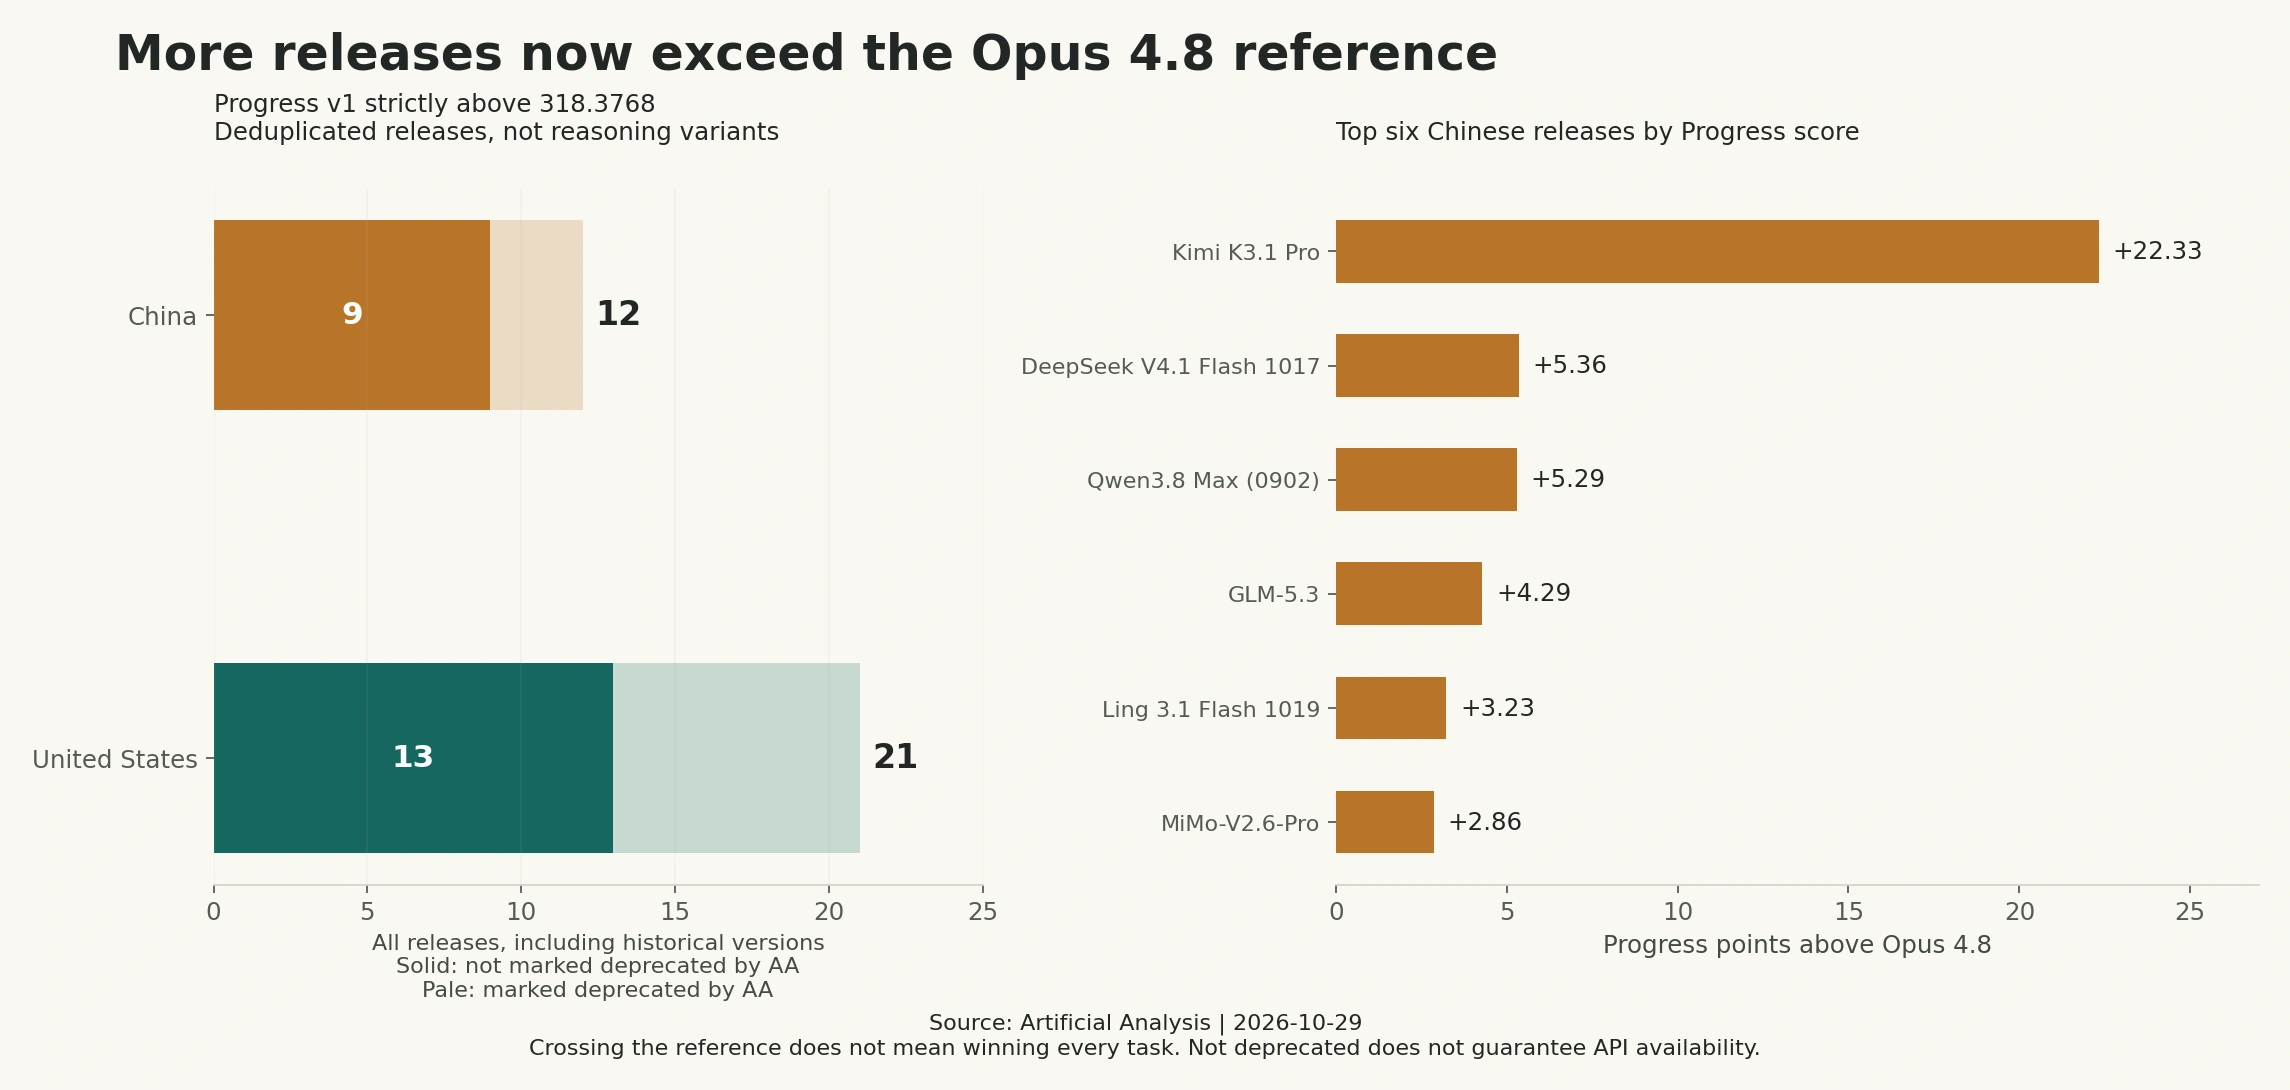
Among the 517 releases, 33 worldwide exceed this threshold, all within the Chinese and US groups in this study: 12 from China and 21 from the United States. Looking only at releases not marked deprecated by AA, the counts are 9 and 13 respectively. An AA marker is a page status; it neither proves that the official service has been shut down nor guarantees current availability through any gateway.
Complete list of Chinese releases above the threshold#
| Chinese model release | Highest Progress score | Marked deprecated by AA |
|---|---|---|
| Kimi K3.1 Pro | 340.70 | No |
| DeepSeek V4.1 Flash 1017 | 323.74 | No |
| Qwen3.8 Max (0902) | 323.67 | No |
| GLM-5.3 | 322.66 | No |
| Ling 3.1 Flash 1019 | 321.61 | No |
| MiMo-V2.6-Pro | 321.24 | No |
| DeepSeek V4.1 Flash | 320.25 | Yes |
| Qwen3.8-Flash-Next | 320.23 | No |
| Ling 3.1 Flash | 320.01 | No |
| Kimi K3 | 319.88 | Yes |
| Qwen3.8 Max | 319.63 | Yes |
| GLM-5.3-Flash | 318.64 | No |
Complete list of US releases above the threshold#
| US model release | Highest Progress score | Marked deprecated by AA |
|---|---|---|
| Gemini 4 Carbon | 351.65 | No |
| Claude Opus 5.5 | 351.27 | No |
| Claude Sonnet 5.5 | 350.50 | No |
| GPT-6 Astra | 349.57 | No |
| GPT-6.1 Sol | 348.47 | No |
| GPT-6.1 Terra | 345.25 | No |
| Muse Wonder Full | 343.22 | No |
| Gemini 4 Argon | 341.79 | No |
| Claude Fable 5.1 | 340.85 | No |
| Muse Wonder | 335.78 | No |
| GPT-6 Sol | 334.04 | Yes |
| Claude Opus 5 | 333.73 | Yes |
| GPT-5.6 Sol | 331.46 | Yes |
| Claude Fable 5 | 329.33 | Yes |
| Claude Haiku 5.5 | 326.13 | No |
| Muse Spark 1.3 | 324.46 | Yes |
| GPT-5.6 Terra | 323.87 | Yes |
| Grok 4.7 | 322.68 | No |
| Grok 4.6 | 321.54 | Yes |
| Gemini 3.8 Flash | 320.30 | No |
| GPT-5.5 | 320.00 | Yes |
A small margin above the threshold cannot automatically be called a “clear lead.” For example, GLM-5.3-Flash is approximately 0.27 points above the reference, and the public data in this study do not provide confidence intervals sufficient to support that comparison. The following table therefore provides only a threshold sensitivity analysis; these added-point bands are not criteria for statistical significance:
| Threshold (Progress v1) | Chinese releases | US releases |
|---|---|---|
| Strictly above Opus 4.8 + 0 points | 12 | 21 |
| Strictly above Opus 4.8 + 1 point | 11 | 21 |
| Strictly above Opus 4.8 + 3 points | 5 | 19 |
| Strictly above Opus 4.8 + 5 points | 3 | 17 |
| Strictly above Opus 4.8 + 10 points | 1 | 14 |
This perspective explains both impressions: there are indeed more options that reach the older flagship level, but the leading options far above it remain concentrated in the US group. Of the 12 Chinese releases above the threshold, only 3 are more than 5 points higher; the United States has 17. All these counts include historical releases and cannot be interpreted as the current API inventory.
How many days apart did the two countries cross this capability threshold?#
In the current Progress v1 reconstruction, the earliest US release above the threshold was GPT-5.5, released on April 23, 2026; for China it was Kimi K3, released on July 16, 2026. The two crossing dates are 84 days apart. Counting instead from Opus 4.8’s own release date of May 28, Kimi K3 arrived 49 days later.[2]
There is no contradiction in GPT-5.5 crossing this retrospective threshold before Opus 4.8 itself: Progress and the Intelligence leaderboard of that time have different objectives, fitting methods, and rankings. The 84 days represent only the difference between the first crossing dates for this specified threshold, not evidence that “all Chinese models are three months behind overall.”
Is the practical difference really as large as the scores suggest?#
This experiment can answer, “Which tasks were delivered successfully under these request conditions?” It cannot replace an assessment of overall human satisfaction. We selected representative current models from the Anthropic series and OpenAI series, while retaining Opus 4.8 as the reference. The Chinese group covers the Kimi series, Qwen series, DeepSeek series, and GLM series. This is purposive sampling and is not used to estimate national average win rates.
Testing took place on October 29, 2026. All requests used the /v1/chat/completions endpoint at https://cn.crazyrouter.com, with reasoning_effort="high", max_tokens=8192, non-streaming responses, no tool calls, a 180-second read timeout per call, randomized ordering, and at most 4 concurrent requests. The same high label does not imply the same internal compute, nor is it equivalent to AA’s highest-tier evaluation of each model.
| Task group | Specific tasks | Scoring basis |
|---|---|---|
| Everyday tasks, 5 types | Order extraction and deduplication, conflict logging, Chinese formatting constraints, locating items among 240 inventory records, refund-rule boundaries | Fixed ground truth, field types, text format |
| Reasoning stress, 3 types | Circular-constraint counting, dependency-based scheduling, combinatorial selection optimization | Unique optimal answer from local exhaustive search / specified tie rules |
Strict passing requires HTTP success, normal completion, and a final answer and format that fully meet the requirements. We retain this pre-agreed primary metric. A separate post-hoc sensitivity check removes only one outer Markdown code fence, without correcting answers or retrying. The latter is closer to “Is the content readable?” while the former is closer to “Can a program consume it directly?”
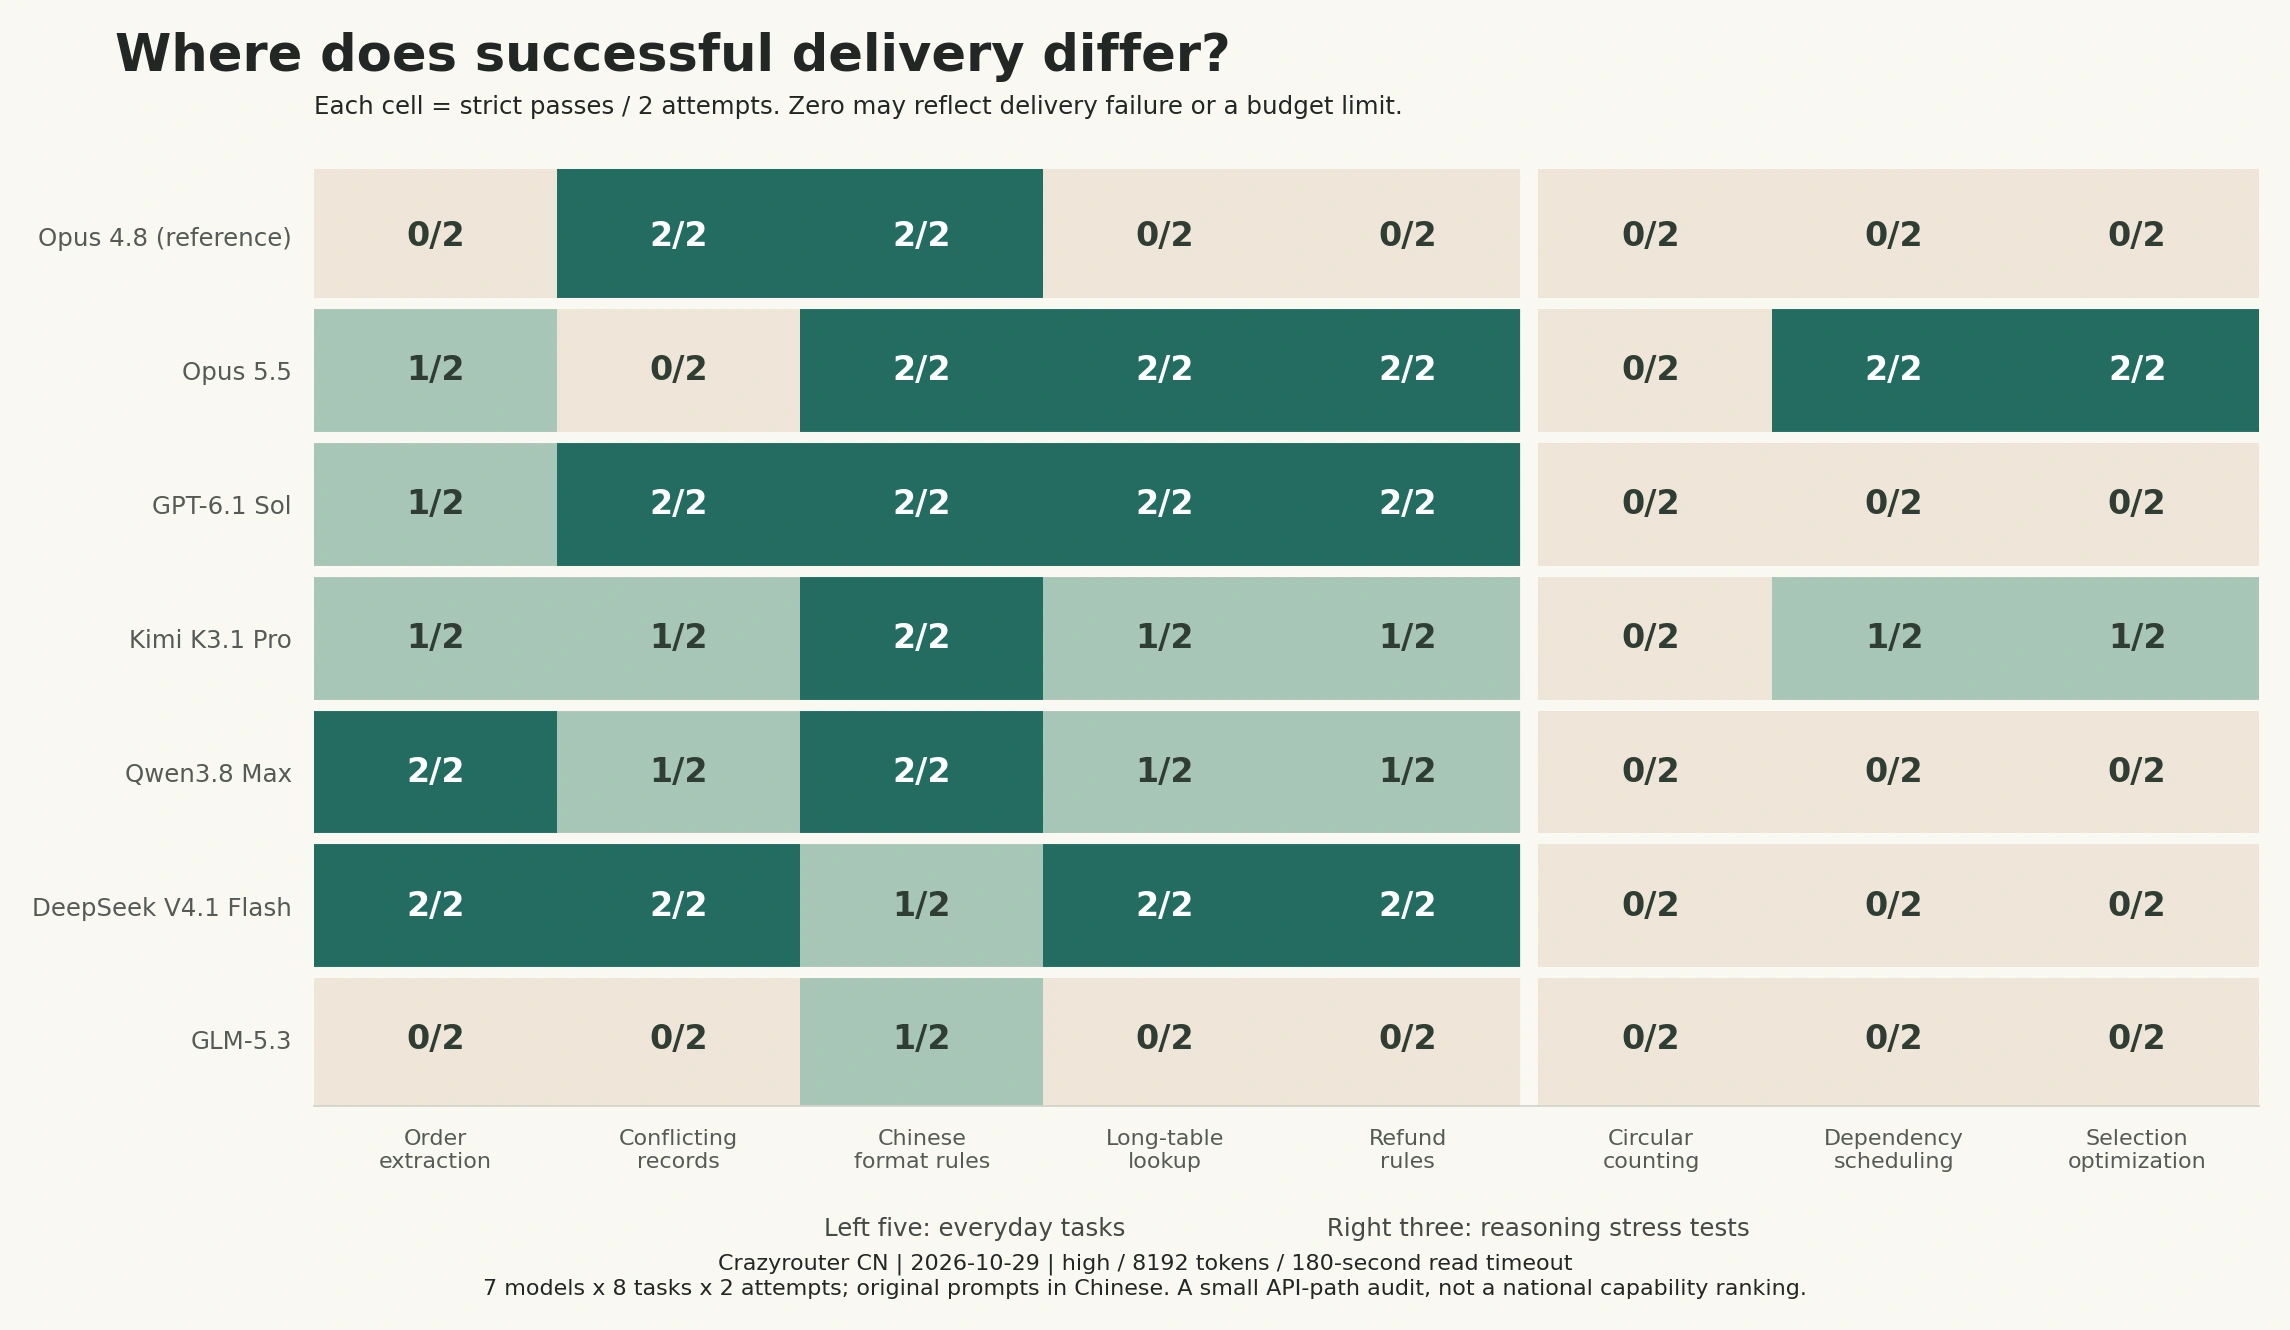
| Requested model | Everyday strict passes / 10 | Stress strict passes / 6 | Total strict / 16 | After removing one fence layer / 16 |
|---|---|---|---|---|
| claude-opus-4-8 | 4/10 | 0/6 | 4/16 | 13/16 |
| claude-opus-5-5 | 7/10 | 4/6 | 11/16 | 16/16 |
| gpt-6.1-sol | 9/10 | 0/6 | 9/16 | 9/16 |
| kimi-k3.1-pro | 6/10 | 2/6 | 8/16 | 8/16 |
| qwen3.8-max | 7/10 | 0/6 | 7/16 | 7/16 |
| deepseek-v4.1-flash | 9/10 | 0/6 | 9/16 | 9/16 |
| glm-5.3 | 1/10 | 0/6 | 1/16 | 1/16 |
Where do the differences appear?#
Take DeepSeek V4.1 Flash and Opus 5.5 in this round: strict delivery on everyday tasks was 9/10 and 7/10 respectively, while stress-task results were 0/6 and 4/6. These are delivery differences under a fixed budget. Failure to finish cannot all be interpreted as “the model does not know how”; stress tasks in particular may exhaust the output budget or fail to finish before the waiting limit.
Another real example comes from Opus 4.8: in order extraction, it returned the correct fields and values but wrapped them in a Markdown code fence, causing the strict JSON check to fail. Reading it in a chat window, you might not consider this an error; feeding the result directly into a program would require an additional cleaning step. The same output can feel different under these two modes of use.
After removing only one layer of code fencing, the results become:
| Requested model | Everyday: after fence removal only / 10 | Stress: after fence removal only / 6 |
|---|---|---|
| claude-opus-4-8 | 10/10 | 3/6 |
| claude-opus-5-5 | 10/10 | 6/6 |
| gpt-6.1-sol | 9/10 | 0/6 |
| kimi-k3.1-pro | 6/10 | 2/6 |
| qwen3.8-max | 7/10 | 0/6 |
| deepseek-v4.1-flash | 9/10 | 0/6 |
| glm-5.3 | 1/10 | 0/6 |
Opus 4.8 and Opus 5.5 both score 10/10 on everyday tasks, but score 3/6 and 6/6 respectively on stress tasks. This provides a concrete example of how the advantage of a more capable model may appear mainly on harder tasks. There are only 5 everyday task types and 3 stress task types here, and two calls to the same task do not constitute two independent tasks. These results therefore cannot prove that everyday capabilities are already equivalent.
Gateways and version mapping also change the experience#
Across the 112 requests, there were 15 HTTP errors, 17 read timeouts, and 7 budget truncations. All these calls remain in the denominators for fixed-budget delivery rates and are listed separately below.
| Requested model | HTTP errors | 180-second read timeouts | Budget truncations | Responses ending normally |
|---|---|---|---|---|
| claude-opus-4-8 | 1 | 0 | 2 | 13 |
| claude-opus-5-5 | 0 | 0 | 0 | 16 |
| gpt-6.1-sol | 5 | 0 | 0 | 11 |
| kimi-k3.1-pro | 6 | 2 | 0 | 8 |
| qwen3.8-max | 1 | 8 | 0 | 7 |
| deepseek-v4.1-flash | 0 | 2 | 5 | 9 |
| glm-5.3 | 2 | 5 | 0 | 9 |
For example, one Kimi K3.1 Pro request returned provider_authentication_failed. This shows that the request was not correctly authenticated upstream and cannot serve as evidence that the model answered incorrectly. Likewise, a read timeout means only that the client did not receive a complete response in time; it does not establish that model computation was slow.
| Requested name | model field observed in responses |
|---|---|
| claude-opus-4-8 | claude-opus-4-8 |
| claude-opus-5-5 | claude-opus-5-5 |
| gpt-6.1-sol | gpt-6.1-sol |
| kimi-k3.1-pro | kimi-k3.1-pro |
| qwen3.8-max | qwen3.8-max |
| deepseek-v4.1-flash | deepseek-v4.1-flash, deepseek-v4.1-flash-1017, deepseek/deepseek-flash |
| glm-5.3 | glm-5.3 |
The response model field is only a server-side declaration, not independent proof of weight identity. In particular, the same DeepSeek request name returned different versions or aliases, so this round cannot guarantee that every request corresponds exactly to the same AA release. These results should therefore be called a “delivery audit of this API path.” They cannot be rigidly paired with AA scores to calculate a correlation coefficient, much less used to declare one country’s models generally stronger or equivalent. This is a path audit, not a national capability ranking.
The GLM-5.3 path also produced responses with extra text appended after JSON, repeated answers, and abnormal markers. We preserve the raw evidence but cannot determine whether the abnormalities came from the model, the template, or upstream adaptation. Its low strict-delivery count is especially unsuitable as a conclusion about base-model capability. We did not change channels or rerun replacements for failed calls in order to obtain better results.
We did not complete human blind evaluation, sampling of production user tasks, long-duration load testing, or multiround Agent evaluation at equal budgets. The evidence therefore remains insufficient to answer whether the “overall experience is equally good.” What can be established is that task type, output format, request budget, and service path can make actual experience differ from a single leaderboard ordering.
Who updates faster? Separate release counts from capability breakthroughs#
The following statistics cover distinct releases in the AA-covered sample, not a complete census of every model released in either country. Multiple inference tiers of one release count only once. Frontier improvements are counted by the date on which they occurred; multiple releases on the same day do not count as multiple improvements.
| Month in 2026 | Chinese releases | US releases | Dates China improved its frontier | Dates the US improved its frontier |
|---|---|---|---|---|
| 2026-01 | 5 | 4 | 1 | 0 |
| 2026-02 | 9 | 7 | 1 | 1 |
| 2026-03 | 12 | 9 | 0 | 1 |
| 2026-04 | 16 | 15 | 3 | 2 |
| 2026-05 | 6 | 4 | 0 | 0 |
| 2026-06 | 6 | 7 | 1 | 1 |
| 2026-07 | 5 | 10 | 2 | 2 |
| 2026-08 | 11 | 10 | 1 | 0 |
| 2026-09 | 8 | 13 | 1 | 3 |
| 2026-10 (through the 29th) | 5 | 10 | 2 | 1 |
From January 1 through October 29, 2026, the sample contains 83 Chinese releases and 89 US releases. Over the most recent 90 calendar days, from August 1 through October 29 inclusive, the counts are 24 and 33 respectively, but each group improved its own Progress frontier on only 4 dates. More releases do not automatically mean greater improvement in maximum capability.[2]
As of this snapshot, China’s most recent frontier improvement was Kimi K3.1 Pro on October 23, and the United States’ was Gemini 4 Carbon on October 28. Data were collected on October 29; the collection date cannot be called a model update date. The AA API does not provide a complete historical score-change log for every model, and we do not invent such a field.
How to reproduce the calculations, and how to test the “experience” next time#
The editorial research archive retains the four AA API response pages, public trend-chart data, the consolidated 517-row CSV, statistical scripts, task ground truth, and all 112 calls with their summaries. The statistics in the published blog come only from these frozen records. The source is Artificial Analysis; the aggregate calculations and Crazyrouter path tests were performed for this article.
The core calculations can be understood through the following pseudocode:
# One snapshot and metric version.
# Use AA release_id, not guessed names.
release_score = max(non_null_scores_for_each_release)
baseline = progress_score_of_opus_4_8_max
above_baseline = release_score > baseline
frontier_at_date = max(scores_of_releases_available_by_date)
gap_at_date = us_frontier_at_date - cn_frontier_at_date
For example, the Opus 4.8 response ID for the order-extraction task is msg_011CgWecKv2YBwoHYumCeURh, with HTTP 200 and normal completion. The original answer was correct JSON wrapped in a code fence, so it failed the strict assessment but passed the format sensitivity check. The request ID for the Kimi authentication failure is 608ccc90b353423d036dca779cafcc37. These two records illustrate the difference between “a result was obtained but its format did not comply” and “no model answer was obtained.”
The following example replays one business-rule task. The API Key is read only from an environment variable, and the endpoint contains no UTM parameters:
import os
import requests

endpoint = "https://cn.crazyrouter.com" + "/v1/chat/completions"
user_content = (
    "\u672a\u62c6\u5c01\u4e14\u7b7e\u6536" "\u6b21\u65e5\u8d777\u65e5\u5185" "\u53ef\u9000\u6b3e\uff1b\u7b2c7" "\u65e5\u5305\u542b\u5728\u5185\u3002"
    "A\u57282026" "-10-20" "\u7b7e\u6536\uff0c202" "6-10-2" "7\u7533\u8bf7\u9000\u6b3e\uff0c"
    "\u65e0\u8d28\u91cf\u7f3a\u9677\u3002" "\u53ea\u8f93\u51faJSO" "N\uff0c\u952eeli" "gible\u4e3a" "\u5e03\u5c14\u503c\u3002"
)

response = requests.post(
    endpoint,
    headers={"Authorization": "Bearer " + os.environ["CRAZYROUTER_API_KEY"]},
    json={
        "model": "claude-opus-4-8",
        "messages": [{"role": "user", "content": user_content}],
        "reasoning_effort": "high", "max_tokens": 8192, "stream": False,
    },
    timeout=(15, 180),
)
response.raise_for_status()
print(response.json())
This is a simplified reproduction example for the article, not one of the complete original tasks from the 112 formal tests. The complete 8 tasks, scoring scripts, and raw records are held in the editorial archive; this article does not provide a public download of the complete raw research package. The simplified task was not used to add to or replace the formal results.
Here, available_by_date means only that the release date is no later than that day; it does not guarantee that a public API was available then. Missing scores are not filled with zero, and one point is not treated as a fixed percentage. Country attribution follows AA’s research-organization labels, with Google included in its labeled US group; it is not based on server location or employee nationality.[1][3]
To genuinely test “experiential equivalence” in the next round, we recommend first fixing three categories of target-user tasks and acceptable differences, then conducting anonymous paired blind evaluations with randomized left-right ordering. Primary metrics should include task-completion quality, major errors, human rework, and preference, with call failure rates reported separately. Equivalence bounds and sample size should be determined before viewing results, with analysis clustered by task. “No statistically significant difference detected” cannot be used to mean “the experience is the same.”
What will this series examine next?#
This article has addressed how score gaps, an older flagship threshold, and actual delivery differ. Future installments will be organized by capability type, using benchmarks suited to each task, fixed budgets, and real API tests. Scores from different modalities will not be combined into a single “national total.” The following are planned topics; these future installments have not yet been published.
| Installment | Planned topic | Key question |
|---|---|---|
| Part 1 · Text models | After crossing the flagship threshold, how large is the gap on everyday tasks? | Differences in Chinese writing, structured output, long documents, factuality, and human blind evaluation |
| Part 2 · Coding and Agents | Can a model that answers also finish the job? | Code modification, passing tests, tool calls, multistep tasks, completion rate within budget |
| Part 3 · Image models | Beyond looking good, who follows image-generation instructions best? | Text-to-image, image editing, Chinese text, subject consistency, and stability across repeated generations |
| Part 4 · Video models | After an impressive single frame, do motion and narrative hold up? | Text-to-video, image-to-video, motion and physical consistency, character continuity, and waiting time for finished clips |
| Part 5 · Speech models | Can they hear accurately, speak naturally, and keep up in conversation? | Speech recognition, speech synthesis, and real-time speech measured separately, with attention to accents and latency |
| Part 6 · Vectors and reranking | Where exactly do knowledge-base performance differences lie? | Chinese and cross-lingual retrieval, long documents, Recall@k, nDCG, reranking gains, and indexing cost |
| Part 7 · Overall selection | How should different models be combined under the same budget? | Consolidating the preceding tests into quality, waiting-time, cost, and reliability choices for specific scenarios |
Each installment will retain three questions: who is at the frontier, who crosses a practical threshold, and whether the gap affects real tasks. The threshold, however, will be defined by a reference model or business acceptance criteria for that modality. For example, Opus 4.8 can serve as this article’s text reference but cannot become a universal threshold for image, speech, or vector models.
Frequently asked questions#
How far apart are Chinese and US AI models, really?#
In this snapshot, the United States leads the AA Intelligence v5 frontier by 13.4 points; the frontier gap on the same Progress v1 scale is 10.94 points. The two measure different things, and neither can be directly converted into a capability percentage or a difference in user satisfaction.
Is the gap getting larger?#
The current retrospective data do not support “continuously widening.” The gap was 27.61 at the end of September 2026 and 10.94 on October 29, narrowing markedly as new models were released. But closing the frontier gap does not mean the leading tiers are already equally deep.
How many Chinese models have surpassed Opus 4.8?#
Using Progress v1, counting distinct releases strictly above Opus 4.8(max), the answer is 12, including historical releases. Of these, 9 have not been marked deprecated by AA. Exceeding an evaluation reference threshold does not guarantee better performance on every one of your tasks.
Why not use Opus 4.8’s score of 61.4?#
The 61.4 comes from the old Intelligence Index at the time of its release; the model has no overall score in this round of v5. Comparisons must use the same scale, and a historical score cannot be applied directly to the new leaderboard.
Are Chinese models already good enough for everyday use?#
A uniform answer cannot be given based on country alone. Some models in this round completed everyday tasks, but gateway errors, formatting differences, and budget truncation also changed the results. Start with your own tasks and acceptable failure rate, then choose a specific model and a reliable calling path.
Can this test prove that Chinese and US models feel the same to use?#
No. It covered only 8 synthetic task types, with 2 calls per task; some requests also involved version aliases and path problems, and there was no human blind evaluation. It illustrates specific reasons leaderboard results and user experience may diverge, but it does not prove overall equivalence.
What is the difference between a release, a model configuration, and an API name?#
One AA release may have multiple inference tiers, while a gateway may use aliases or rolling updates to a new version. Leaderboard counts are deduplicated by release; the tests retain both the actual requested name and the returned model field. The two do not automatically correspond one-to-one.
References#
- Artificial Analysis Data API: field, pagination, version, and missing-value definitions. Complete collection for this study took place on 2026-10-29; the API reported Intelligence version 5.
- Artificial Analysis AI Trends: Progress, country attribution, and releases. Anonymous public-page snapshot from 2026-10-29 for this study; the statistics in this article are the author’s recalculations from that snapshot.
- Artificial Analysis Progress Index v1 methodology. The IRT scale, tiers, and limits of historical comparison.
- AA Intelligence Index v5 release announcement, 2026-10-27. Used to explain evaluation changes, not as a substitute for the latest leaderboard on October 29.
- AA Intelligence Index methodology and version notes.
- AA Opus 4.8 release evaluation, 2026-05-28 and current model page.
- Official Anthropic Opus 4.8 release page.
In this article, “exceed” and “lead” are limited to explicitly defined scales and the covered sample; they do not imply statistical significance. Results must be recalculated if AA later adds tests, revises data, or adds models.