 简体中文
 繁體中文
 English
 Français
 Русский
 日本語
 Tiếng Việt
 한국어
 Deutsch
 Español
 Italiano
 Português
 العربية
 ไทย
 Bahasa Indonesia
 Bahasa Melayu
 Türkçe
 Polski
 Nederlands
 Dansk
 Norsk
 Қазақша
DeepSeek on 4 NVIDIA Spark Systems: Self-Hosting vs. the Crazyrouter V4.1 Flash 1017 Baseline
Historical tests compare four self-hosted Spark nodes with the Crazyrouter 1017 baseline: speed, caching, load, interruptions, and gateway latency.

Can DeepSeek self-hosted on four NVIDIA Spark systems approach the performance of a ready-to-use API? We reviewed tests from November 3–4, 2026. In the same-round comparison, the Crazyrouter baseline generated output faster. Subsequent Spark results varied substantially by time of day, with a large difference between lightly loaded and busy periods.
In the small-sample comparison on November 3, median output speeds for the Crazyrouter DeepSeek V4.1 Flash 1017 baseline were 147.31 token/s with short inputs and 136.87 token/s with long inputs. The four-node Spark deployment achieved 41.46 and 10.02 token/s, respectively. Both sides completed 6/6 speed-test requests.1
This article examines the service as deployed: how long users waited for the first text, how fast the stream arrived, whether repeated context hit the cache, and whether requests completed within the test deadline during busy periods. The data comes from historical records. These are not new measurements from November 20 or a promise about current service conditions. All times below are Beijing time.
First, were the 1017 baseline and self-hosted Spark running the same version?#
For background on the model family, see the Crazyrouter DeepSeek model page. For Spark product information, see the official NVIDIA DGX Spark page. These pages provide further reading; the historical performance findings come from the test records described here.
Both sides were requested as deepseek-v4.1-flash, but the model names returned in their responses differed:
| Service compared | Model name in the response | What was confirmed at the time |
|---|---|---|
| Crazyrouter baseline DeepSeek | deepseek-v4.1-flash-1017 | The response identifier included the 1017 suffix |
| DeepSeek self-hosted on four Spark systems | deepseek-v4.1-flash | Inspection confirmed inference rank processes on all four GB10 nodes |
The historical records do not fully document the self-hosted model's weight hash, exact revision, or quantization settings. We therefore use DeepSeek V4.1 Flash 1017 specifically to describe the baseline's response identifier. We do not claim that identical weights were verified on both sides. A response name alone is not an independent identification of the weights.2
When searching for “NVIDIA Spark deepseekv4.1flash1017 self-hosting,” distinguish these two checks: providing a compatible interface and proving that exactly the same model revision is running require different evidence. This article compares the two actual service paths at the time. It is not a GPU hardware ranking with every variable controlled.
Test method: the same entry point, fixed routes, and a fixed output budget#
The main test on November 3 called two fixed routes through the same Crazyrouter entry point. One reached the baseline service, and the other reached the four-node Spark deployment. Responses from other routes were not mixed into their results, and route settings were not changed during the test.
The historical test used this address:
Base URL: https://crazyrouter.com/v1
Endpoint: POST /chat/completions
Model: deepseek-v4.1-flash
The core parameters are shown below. This is an excerpt of the measurement settings; full requests also included the same task text and a prefix distinguishing each test round:
{
  "model": "deepseek-v4.1-flash",
  "stream": true,
  "temperature": 0,
  "max_tokens": 768,
  "thinking": { "type": "disabled" }
}
Short inputs contained 64 tokens and long inputs 6,230 tokens, with three requests for each. The long-input text was repeated to observe caching. Consecutive long requests were separated by six seconds after the previous request ended. Routes were tested in parallel, while requests within each route were sequential.
The complete historical round covered four routes and 26 formal requests. This article focuses on the 12 requests to the baseline and Spark. The other two routes provide a reference range. One separate smoke-test request is excluded from the statistics. All formal requests were reconciled with usage logs for the actual route and token counts.
Every main-test request produced 768 output tokens and zero reasoning tokens. Here, “completed” means the client received the complete stream termination and usage record. Ending at the budget with finish_reason=length was expected in this speed test. A 6/6 completion count is not answer accuracy and does not mean the model naturally finished a business task.
We measured two distinct timings. Time to first text begins when the client sends the request. Output speed is the output token count divided by the interval from the first content chunk to the last content chunk. This is a client-side approximation that includes tokens in the first chunk but excludes connection and queueing time before that chunk. Tables report medians of three requests.1
Same-round results: similar first-text waits, different sustained output speeds#
| Metric | Crazyrouter 1017 baseline | Four-node Spark self-hosted |
|---|---|---|
| Completed requests | 6/6 | 6/6 |
| Short-input median time to first text | 3.31 seconds | 3.25 seconds |
| Short-input median output speed | 147.31 token/s | 41.46 token/s |
| Short-input median total time | 9.05 seconds | 21.78 seconds |
| Long-input median time to first text | 3.36 seconds | 7.73 seconds |
| Long-input median output speed | 136.87 token/s | 10.02 token/s |
| Long-input median total time | 9.09 seconds | 84.40 seconds |
| Slowest individual request, total time | 10.26 seconds | 156.11 seconds |
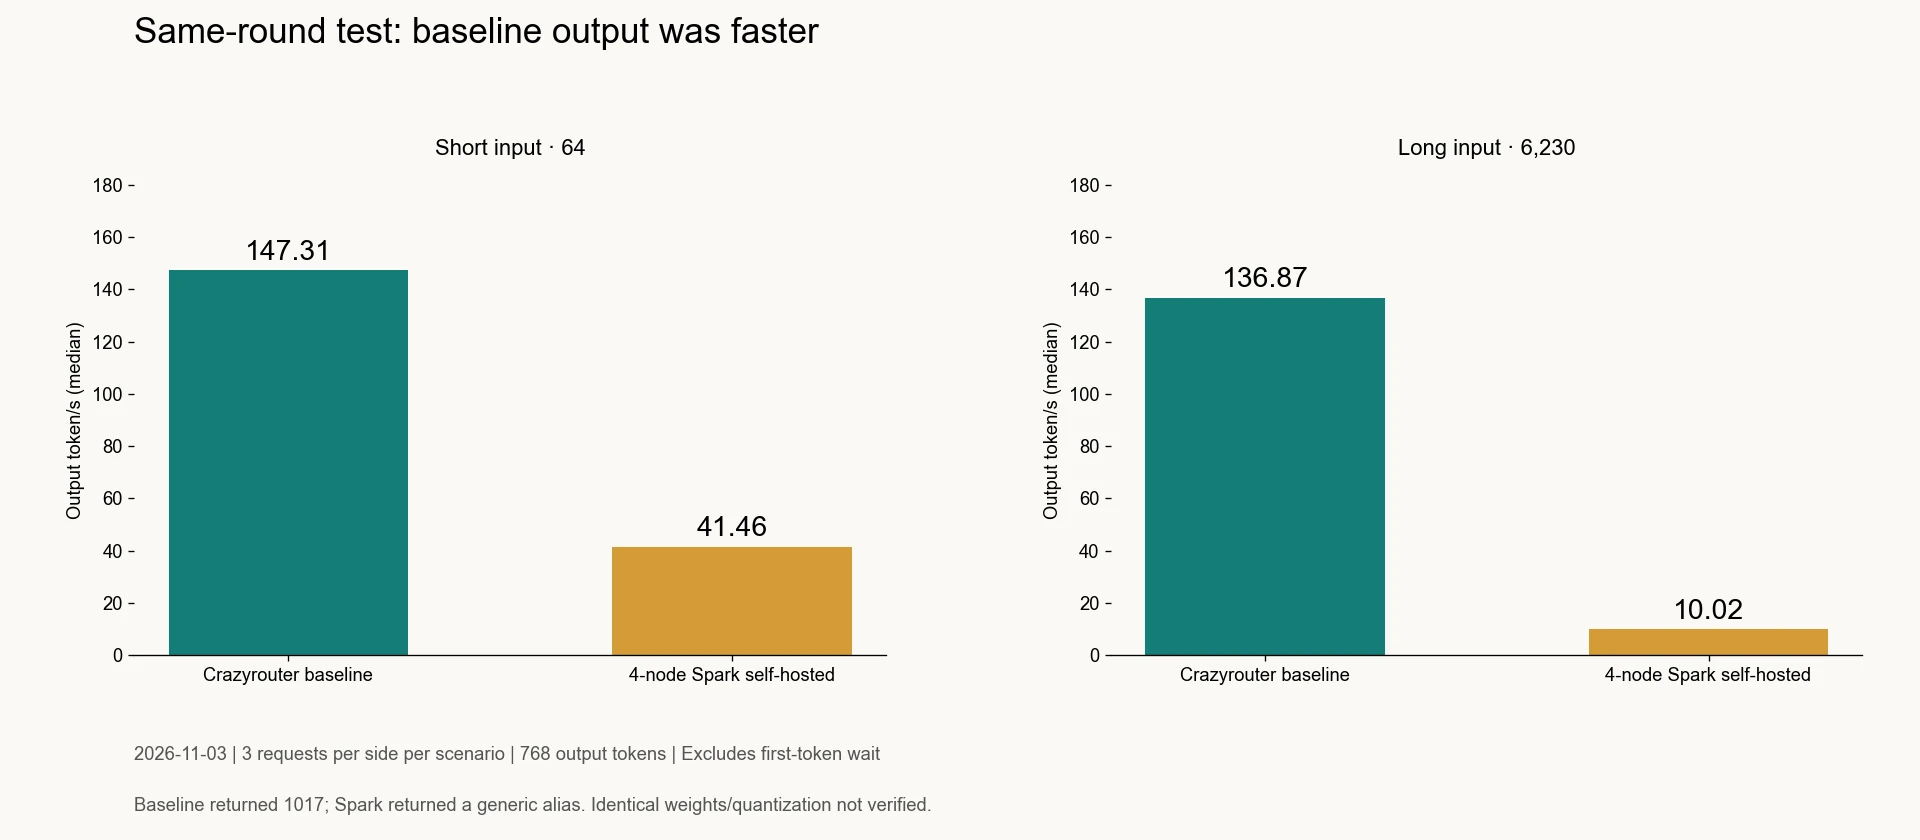
Figure 1. November 3, 2026, with three requests per service per scenario. Output speed excludes the wait for the first text. Identical weights and quantization were not verified.
For short inputs, Spark's wait for the first text was slightly shorter, but it generated the remaining output more slowly and took longer overall. Using the median output speeds, the baseline was approximately 3.55 times as fast for short inputs and 13.66 times as fast for long inputs. These ratios describe service conditions in this round; they do not establish a hardware ceiling for four Spark systems.
Spark also had a pronounced slow request. The third short-input request took about 105.38 seconds, at roughly 7.47 token/s, although it eventually completed. A request that does not return an error can still deliver an inconsistent interactive experience. The other two reference routes had short-input median speeds of 143.69–148.13 token/s and long-input medians of 130.20–141.49 token/s. The baseline's speed was therefore not an isolated outlier among the four routes in this round.1
Why did speed fluctuate even when the cache was hit?#
The main test recorded the following long-input cache usage:
| Service path | Cached tokens across three long requests | Cached share of input on the final request |
|---|---|---|
| Crazyrouter baseline | 0 → 6,144 → 6,144 | 98.62% |
| Four-node Spark self-hosted | 0 → 0 → 0 | 0% |
Looking only at that round could suggest that Spark did not support caching. Later records showed otherwise. In the November 4 retest at 01:04, the long-input cache sequence was 0 → 6,234 → 6,234, with 99.98% of input cached on the last request. Yet the median long-input output speed was still only 13.37 token/s. The three requests ran at 13.37, 12.90, and 45.15 token/s, so even the two cache-hit requests differed substantially.3
In the 14:14 retest, the last long request had a cached-input share of 82.13%, while median output speed reached 57.91 token/s. Cached-token share alone cannot explain the speed of an entire response. Nor is it a percentage cost saving: this test did not use that figure to calculate a cost advantage.
How much did the same Spark deployment vary across four time periods?#
The retests used the same task text and output parameters. Each round had a unique prefix, so short inputs ranged from about 64–69 tokens and long inputs from about 6,230–6,235 tokens. The requests were not identical token for token.
| Test time | Completed | Short-input output speed | Long-input output speed | Short-input first-text wait | Long-input first-text wait |
|---|---|---|---|---|---|
| November 3, 23:43 | 6/6 | 41.46 token/s | 10.02 token/s | 3.25 seconds | 7.73 seconds |
| November 4, 01:04 | 6/6 | 50.69 token/s | 13.37 token/s | 4.25 seconds | 3.61 seconds |
| November 4, 14:14 | 6/6 | 56.70 token/s | 57.91 token/s | 2.04 seconds | 5.31 seconds |
| November 4, 20:24 | 3/6 | 16.84 token/s* | 7.07 token/s* | 51.96 seconds* | 37.59 seconds* |
Evening medians include only completed requests: 2/3 short requests and 1/3 long requests completed. The other three were interrupted and are excluded from the speed and first-text-wait medians.
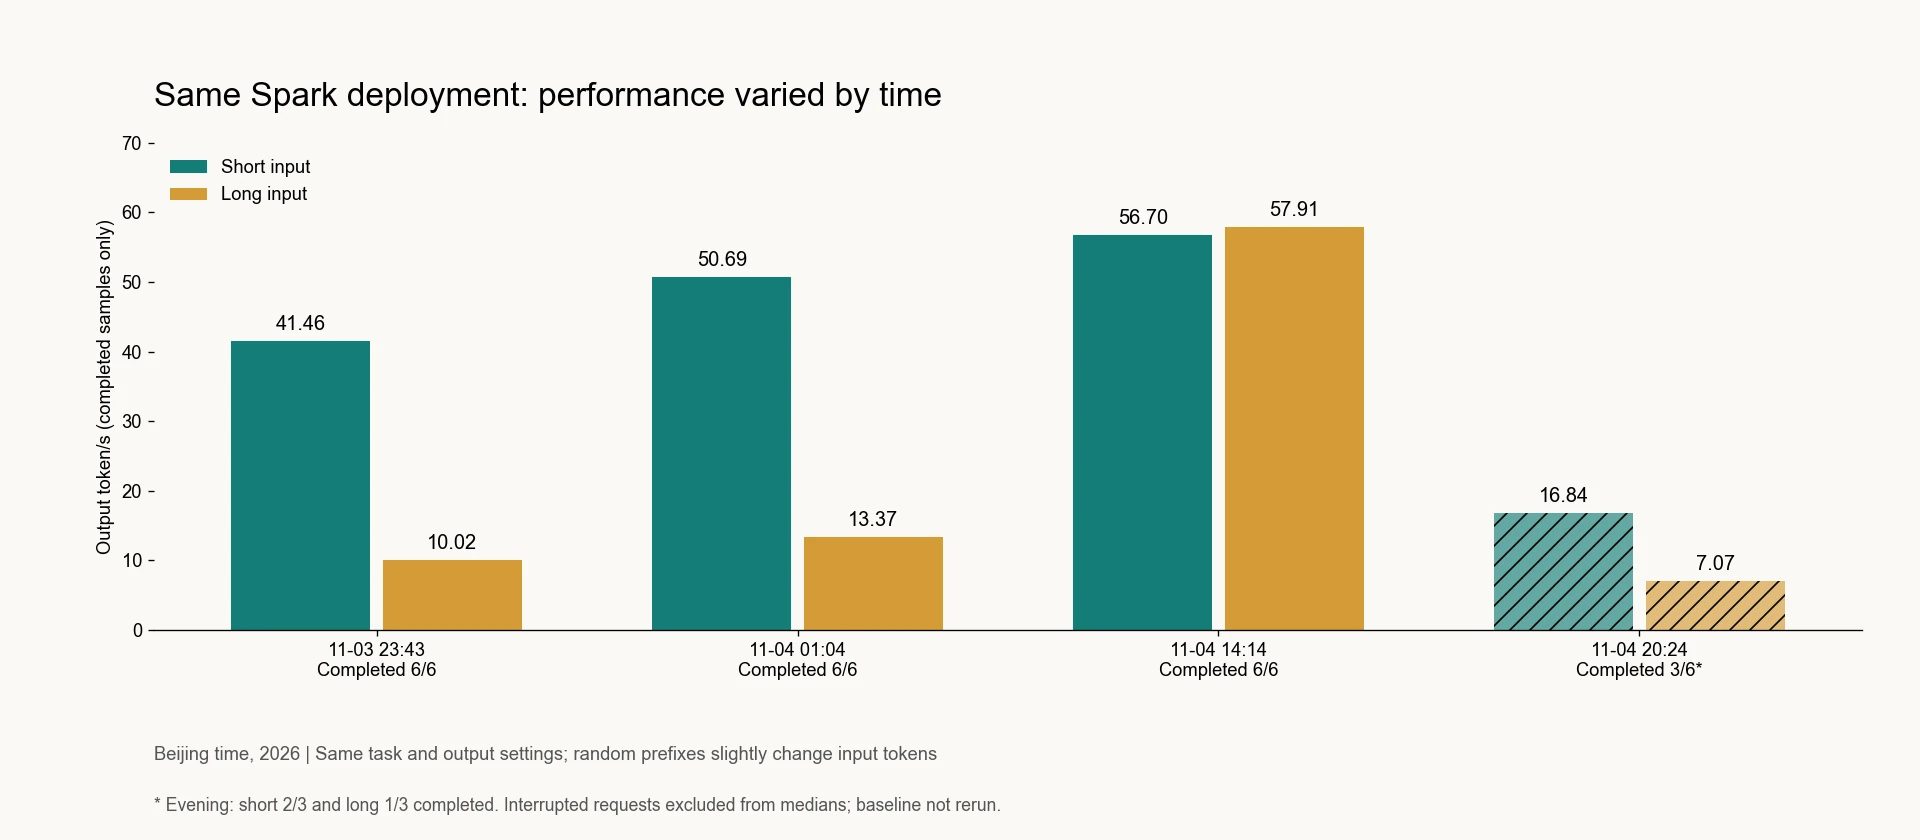
Figure 2. The later three rounds retested only Spark. The Crazyrouter baseline was not rerun simultaneously. Combining an older baseline with a later measurement does not create a same-round controlled comparison.
The three interrupted evening requests received HTTP 200 headers and some streamed content but did not finish normally. The client ended the calls after approximately 166–187 seconds, and site logs recorded 499 client disconnects. Counting HTTP 200 responses alone would incorrectly label that round as 6/6 completed.3
The key evening result is therefore that only three of six requests completed, not just that completed requests ran more slowly. This small sample also cannot estimate long-term availability.
Where did the delay come from? Load and queueing were the strongest observed explanation#
Read-only inspection confirmed inference processes on all four GB10 nodes. The service's capacity snapshot reported slots=4 and peak_batch=4. Those values describe the engine configuration at that time, not a universal capacity limit for four Spark systems across all software and models.
The same running service recorded two different load conditions:
- November 4, 19:44, under lighter load. Server logs showed 104.8–156.8 token/s for requests with 32 or 59 input tokens and 256 output tokens. Time to first text was 0.115–0.148 seconds. The reconstructed snapshot had only one unfinished request and none with more than 10,000 input tokens.
- 20:24, when the slow test began. Reconstructing request intervals from completion times and durations showed at least 12 unfinished requests with more than 10,000 input tokens each, totaling around 1.53 million input tokens. Another snapshot at 20:33 showed at least 16 such unfinished requests.4
These counts include requests waiting and executing. They are lower bounds reconstructed from historical logs, not a claim that 12 or 16 requests were decoding on GPUs simultaneously. The records did not establish the source of the other traffic.
Spark could generate quickly under lighter load. When many long-context requests remained unfinished, clients could wait a long time for content. Direct model calls also stalled during the busy period, so not every delay can be attributed to the Crazyrouter gateway.
Long-context load and queue contention are the explanation most strongly supported by the available observations. However, without complete stage-level traces, the delay cannot be apportioned precisely among scheduling, prefill, decoding, and transmission. The 19:44 measurements were server-side observations using short prompts and 256 output tokens. They cannot be pooled with the main client-side test using 768 output tokens.
Did the Crazyrouter gateway add latency? It did in two additional paired tests#
At 22:16 on November 4, two paired tests ran under lighter load. In each pair, requests were sent simultaneously to the same self-hosted Spark service, one directly through its public endpoint and one through Crazyrouter. Both used the same 26-token input and a 256-token output budget.
| Pair | Path | Time to first text | Total time |
|---|---|---|---|
| 1 | Direct to Spark | 0.786 seconds | 3.779 seconds |
| 1 | Via Crazyrouter to the same Spark | 6.150 seconds | 8.307 seconds |
| 2 | Direct to Spark | 1.031 seconds | 4.301 seconds |
| 2 | Via Crazyrouter to the same Spark | 3.704 seconds | 7.496 seconds |
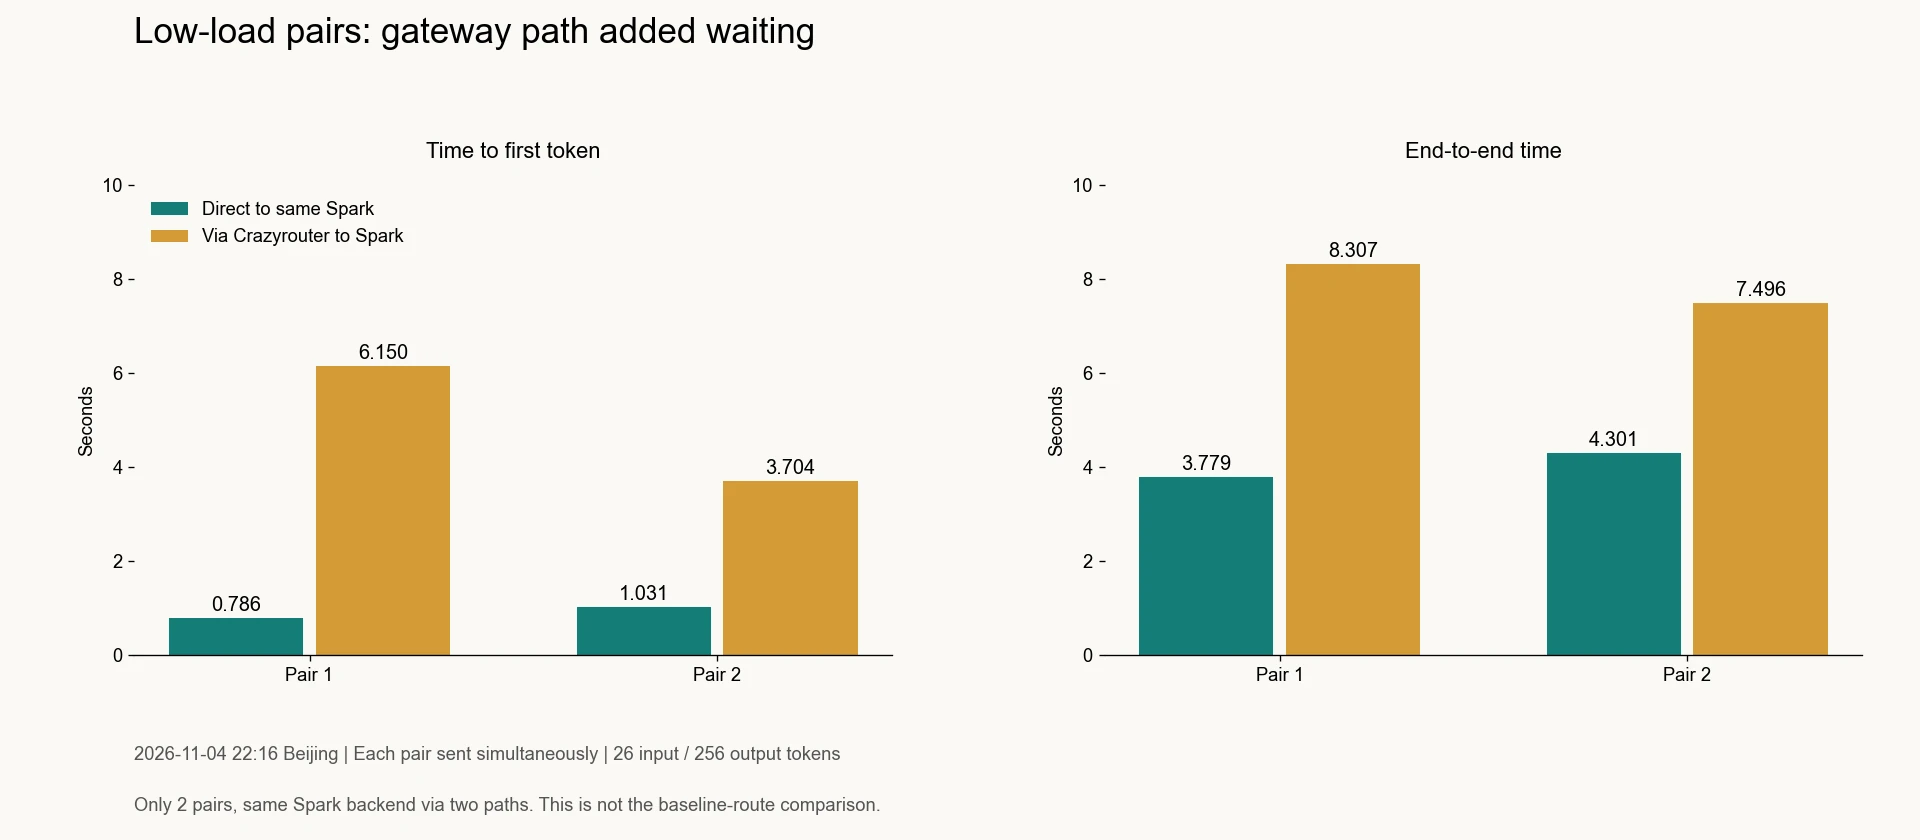
Figure 3. This compares access paths, not Spark against the earlier 1017 baseline. Requests in each pair were sent simultaneously, but did not necessarily reach the inference service at the same time.
Total time through the gateway was 4.528 seconds longer in the first pair and 3.195 seconds longer in the second. Backend processing durations were similar, suggesting that some additional waiting occurred before requests reached the inference service. Two pairs are insufficient to separate gateway processing, outbound connection setup, and the public endpoint mapping, or to treat the observed difference as fixed gateway overhead.5
Choosing a faster upstream baseline and adding a forwarding layer to the same self-hosted backend are different comparisons. The main test supports the finding that the baseline was faster in that round. The paired tests also show that direct access to Spark completed sooner than gateway access in those two pairs.
How should a team planning to self-host use these results?#
The records show that four Spark systems could run this DeepSeek service. Providing predictable request performance, however, requires more than a single lightly loaded speed test.
For the next deployment acceptance test, we recommend four concrete checks:
- Fix and record the model version first. Record the weight revision and hash, quantization, inference engine version, and topology. An interface alias alone does not establish an identical model.
- Test the workload mix used in production. Include short conversations, roughly 6K-token contexts, and the long requests your application actually sends. Check whether short requests slow down when mixed with long ones.
- Record waiting time, generation speed, and completion together. Retain interrupted samples. With enough observations, measure P95/P99 rather than highlighting only the fastest request.
- Align client and server timing. Compare direct and gateway paths under both idle and busy conditions to identify which stage needs improvement.
If response speed under the conditions tested here is the priority, the Crazyrouter baseline had the advantage in the same-round results. If the goal is control over the deployment environment and scheduling policy, these Spark records provide useful acceptance-test evidence. A self-hosting decision still needs capacity, quality, recovery, and operational-cost data.
We did not measure the purchase or rental cost of the four machines, electricity costs, power draw, utilization, or maintenance hours. We also did not score answer quality. This article cannot establish that self-hosting is cheaper or that either model produces better answers.
Frequently asked questions#
Can DeepSeek V4.1 Flash 1017 self-hosted on four NVIDIA Spark systems replace an API?#
The records establish that a service running on four GB10 nodes could respond to DeepSeek requests. They do not confirm that its weights were the same 1017 revision. Replacing an API depends on actual load, response deadlines, quality requirements, and operational needs. The evening result of 3/6 completed requests shows why busy-period acceptance testing is necessary.
Is the 13.66-times difference in the main test a hardware performance gap?#
No. It is the ratio of median long-input output speeds in one round. It includes differences in cache state, load, inference service behavior, and access paths. It cannot be interpreted as a ratio of GPU compute performance.
Why was it still slow with a 99.98% cache-hit share?#
The input was almost entirely cached in that round, yet median long-input output speed was 13.37 token/s. Cache share alone does not characterize overall performance. The historical records lack sufficient stage-level timing to quantify the contribution of each factor.
Can Spark generate more than one hundred tokens per second?#
Historical server logs recorded 104.8–156.8 token/s under lighter load with short inputs and 256 output tokens. That measurement differs from the client-side 768-token main test. It should not be presented as sustained performance guaranteed under any workload.
Does HTTP 200 count as a successful request?#
It did not suffice in the evening test. Three requests received HTTP 200 and partial content but were interrupted before normal completion. We therefore recorded 3/6 completed requests, not 6/6.
Which is cheaper: self-hosting or Crazyrouter?#
This article lacks complete, comparable cost data, so it cannot answer that question. A cost model should compare hardware, utilization, operations, and failure-retry costs with actual API bills at the same workload volume. Check current rates on the Crazyrouter pricing page, but do not treat current prices as the actual cost of a historical test.
Test records and further reading#
For application setup, see the Crazyrouter integration guides. For a separate comparison of task accuracy and actual spending, read the GPT-6.2 Sol versus DeepSeek V4.1 Flash cloud benchmark (in Chinese). Its tasks and scoring methods differ from this speed test, so the results cannot be combined.
This article was assembled from Crazyrouter's historical test archive, with statistics recalculated on November 20, 2026. The original samples, route-verification records, and machine-diagnosis index are archived internally. The notes below describe the source and statistical scope of each dataset.
Author: Sophie M · Article prepared: November 20, 2026 · Data collected: November 3–4, 2026.
Footnotes#
-
Four-route main test on 2026-11-03, with 26 formal requests. This article uses six requests each for the baseline and Spark. Per-request records, summaries, and usage logs were cross-checked. ↩ ↩2 ↩3
-
The model fields in main-test responses and the four-node machine inspection on 2026-11-04. These confirm response identifiers and running deployment processes, not identical weights. ↩
-
Three Spark retest rounds on 2026-11-04 at 01:04, 14:14, and 20:24, with six requests per round. The three evening client interruptions were retained separately. ↩ ↩2
-
Machine-diagnosis records from 2026-11-04. Unfinished-request counts were reconstructed from completed-request durations and include waiting and executing requests. ↩
-
Direct-versus-gateway paired follow-up on 2026-11-04 at 22:16. Two pairs of requests, each with 26 input tokens and 256 output tokens. ↩
Implementation Guides
Podcast
AI Dev Tools: The Crazyrouter Podcast
Short episodes for developers on AI APIs, gateways, cost control and coding tools.
Latest episodes
EP196 · Oct 29, 2026 · 6:53
AI API Security Posture — Turn Controls Into Continuous Evidence
A practical guide to AI API security posture: inventory exposure, verify controls continuously, protect keys and data, constrain tools, and turn security assumptions into evidence that operators can act on.
EP195 · Oct 28, 2026 · 7:21
AI API Policy Drift — Detect When Production Rules Stop Matching Intent
A practical guide to policy drift in AI APIs: version routing and safety rules, detect stale enforcement, compare intended and observed behavior, and restore control before small gaps become incidents.